Wed,Sep 18,2013
The International Energy Agency (IEA) announced Wednesday to activate a comprehensive overhaul of the statistics pages of its website, in the meanwhile, to release more than 20 years of global energy data it has collected.
To "boost transparency and user-friendliness," it is the first time for IEA to release "more than 20 years" of energy data online "for more than 140 countries and regions worldwide," said IEA in a statement.
The enhancements will give users easy access to the IEA's wealth of information on fuels, emissions, taxes, prices and more going back to 1990.
The "interactive features" were also added, which allow for customizable, interactive graphics that can easily "tell the global energy story over several decades."
"The IEA is the world's most authoritative source of energy data, and in a world in which all nations face common energy challenges it is all the more important to share information," said van der Hoeven, IEA Executive Director Maria.
"Our enhanced website now gives citizens and governments easy access to the same critical information needed for everyone to work towards a secure and sustainable energy future," the director observed.
So far, only one year's worth of data was available on the IEA's website. "But as part of the revamped site, users anywhere in the world can view data from 1990 through 2011," said IEA.
Furthermore, the very latest results from the IEA monthly survey of OECD oil, natural gas, electricity and prices are also available online.
"Statistics are critical to the IEA and to energy analysts worldwide, and more people visit the IEA Statistics web pages than any other section of our website," said Jean-Yves Garnier, head of the IEA Energy Data Centre, the IEA's statistics arm.
The website features seven tables of critical data for each country and region, ranging from energy production trade and transformation to the final consumption by sub-sector.
Moreover many of the statistics are given as compound indicators, like electricity consumption per capita or energy-related CO2 emissions divided by GDP.
The new statistics pages include the prominent "Sankey diagrams," which help users visualize energy transfers for the world, specific regions and individual countries, which can be animated to show year-to-year changes dating back as far as 1973.
Founded in 1974, statistics collection has been a principal activity of the IEA, providing the basis for its analysis and recommendations in many domains, from production and consumption of all the major fuels to energy-related CO2 emissions, and the results are verified using internal checks, market intelligence and discussions with countries.
 Pakistan suffers desperate shortage of water
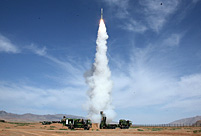 New model of indigenous surface-to-air missiles testfired
  Heritage train ride across western Kosovo
 Baby girl 'too young' for birthmarks treatment
 Beijing court hears airport blast case
 Harbin named Chinese city with most beautiful women
 Wushu spirit
 Rugby girls
 Funniest photos of sport stars as kids
  Residences of the royal house of Savoy
 China's frigate 'Bengbu'in fire training
 The last days of Wan Aihua
 Highlights at 12th National Games of China
 Beijing Film Academy welcomes freshmen
 2013 Taiwan Int'l Tourism Expo kicks off in Taipei
Day|Week|Month